Creditas financial results Q1-2023

São Paulo, 25th April 2023
Context of the business
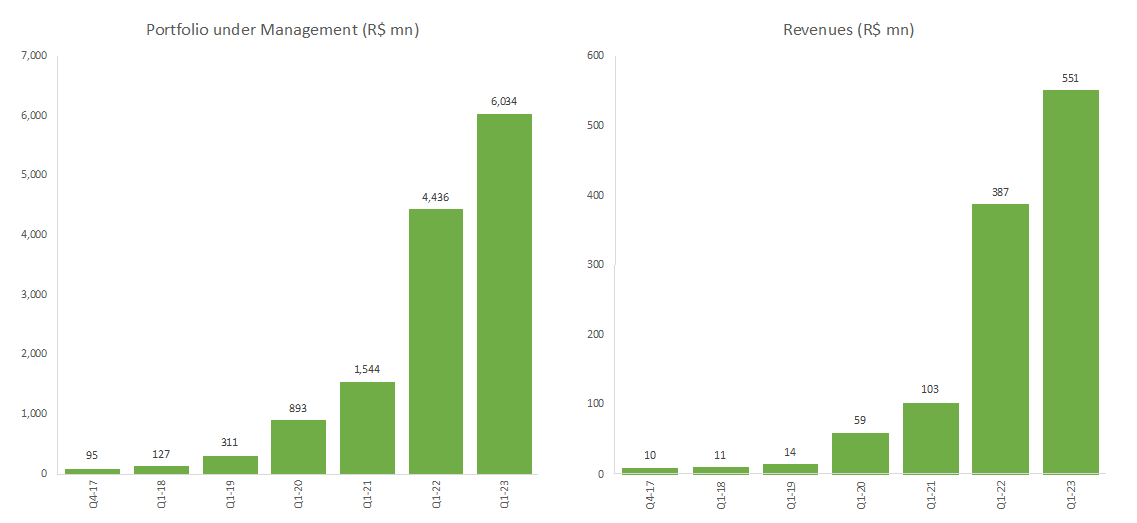
In Q1-23, we posted revenues of R$551mn, a 42.3% increase compared to Q1-22 as we continue focusing on more moderate growth to become a profitable company by year end. Focusing on the financial margin and a tight monitoring of credit quality are allowing us to progressively improve gross profit, Although still far from our steady state, gross profit in Q1-23 at R$118.9mn represents a 164% increase vs. Q1-22. Gross Profit Margin as a % of revenues has moved in 12 months from 11.7% to 21.6% as we benefit from stable SELIC rates, continued repricing of our portfolio and the high quality of our credit portfolio. Costs below Gross Profit continue trending down at R$248mn (-33% vs a year ago) allowing us to continue narrowing our net losses. We believe that our breakeven strategy is becoming more evident over recent quarters, and we expect to reach profitability by year end, while maintaining healthy growth. Quarterly Gross Profit margin will continue normalization to reach R$200mn from the current R$118.9mn while overhead costs will reduce from the current R$248mn to below R$200mn.
We have had some good news on the macro scenario. Prices continue dropping in Brazil, with the March IPCA reading coming at 4.65% for the last 12 months. The market continues to expect inflation at 6.0% by 2023 and 4.0% in 2024 with the anticipated SELIC rate at 12.5% by end of year and 10.0% by end of 2024 (vs. 13.75% today). This, together with the recent rally of BRL vs USD, has increased the chances of SELIC rate cuts in the near term.
At Creditas, our plan-to-profitability designed a year ago continues to be executed at full speed. We are successfully increasing efficiency, operational leverage, and portfolio repricing. Q1-23 was the 2nd quarter with stable SELIC and with that our Gross Profit margin has accelerated as new repriced loans start replacing older lowered-priced loans. Credit quality performance was better than expected in Q1-23, showing further reduction of cost of credit in the quarter despite the front-loading of provisions under IFRS. We continue focusing our technology and data analytics efforts on features and developments to further optimize the cost of acquiring customers, to gain efficiency and improve our portfolio management and hence support our strong credit quality.
Following is an update on the action plan we designed:
1. Keep portfolio growth high and sustainable: our portfolio grew 36% in Q1-23 vs a year ago despite tighter underwriting and a less aggressive approach to growth. We continue balancing growth and profitability so that portfolio growth provides future gross profit while keeping our eyes on the negative short-term impact related to growth (IFRS provision frontloading and customer acquisition cost).
2. Accelerate repricing of loan portfolio: pre-fixed loan pricing for new origination has remained almost stable at 57%, similar to Q4-22 but significantly higher than the 32% we saw in Q3-21, signaling the end of our price increases as SELIC stabilization keeps our cost of funding constant. Consequently, pricing of our pre-fixed portfolio continues increasing, from 32% in Sep-21 to 43% in Mar-23 (41% in Dec-22). This trend will continue through 2023 as the decay of our pre-fixed portfolio is replaced by newer loans at new rates, accelerating gross profit expansion.
3. Increase gross profit: after gross profit compression during second half of 2021 and early 2022 due to high growth (IFRS provisions impact) and rising interest rates (funding cost impact), we are now experiencing the reverse effect with gross profit margin expanding from 10.1% in Q2-22 to 21.6% in Q1-23 (14.5% in Q4-22). We expect this trend to continue through 2023 as we regain 40%+ gross profit margins. The combination of loan repricing, a growing portfolio, stabilized cost of funding and lower IFRS provision impact creates significant tailwinds for profitability. As we will discuss later in this document, despite record-high inflation and interest rates, we have not seen a significant deterioration of credit quality and our portfolio remains highly resilient. We expect the impact of the cycle to remain minor in our gross profit due to the presence of collaterals in all our financial products, something that we are already seeing as part of continuous cost of credit reduction for the three consecutive quarters since Q2-22.
4. Acquisition of Andbank’s Brazilian banking operations: after signing the acquisition agreement in July, Andbank completed the capital increase following the authorization from both Brazilian and European authorities, strengthening the balance sheet and accelerating deposit growth. The acquisition is in the process of approval by the Brazilian Central Bank.
5. Reduction of customer acquisition cost: we have managed to bring our customer acquisition cost to the minimum level ever thanks to (i) the impact of our automation efforts in both lowering acquisition costs and increasing conversion and (ii) returning users and repeating customers now representing most of our new loan origination. In addition, as our portfolio grows and loan repricing materializes, CAC represents a significantly lower portion of our revenues.
6. Rationalizing our overhead: with significantly reduced hiring after March 2022, we continue increasing productivity per employee and expect to continue gaining operational leverage during 2023.
7. Migration of Creditas Auto business model: After the change in the business model of Creditas Auto, we are now focusing on (i) reducing the existing inventory of cars to zero over the next 3 months and (ii) focusing on C2C transactions (purchase of cars between individuals). We are seeing good initial traction on this new model but there are still many things that we need to develop to gain scale in the model.
Financial results
Quarterly results for the period Q1-2022 through Q1-2023

Operating performance
Q1-2023 revenues posted at record R$550.7mn compared to R$387.0mn in Q1-2022, a 42% increase despite the reduction in portfolio growth rates (36% YoY growth) and reduction in our car sales business as part of our new asset light strategy (-13% car sales reduction YoY as we continue reducing our car inventory). Portfolio under management reached R$6,033mn compared to R$4,436mn in Q1-2022.
We continue being very restrictive in our Auto Finance product while mostly keeping our standard policies in Car Equity, Home Equity and Private Payroll loan products where we are seeing low volatility at this point in the cycle. Given the low LTVs of these products, we believe our product category is ideal to maintain resilience in the current environment.
After seeing our Gross Profit margins bottoming in Q2-2022 due to the impact of the sharp increase in SELIC and the impact of IFRS provisioning frontloading related to our high growth strategy, we are experiencing an acceleration in Gross Profit, which has increased 114% since Q2-2022 from 10.1% to 21.6%. Gross Profit benefited both from continuous loan portfolio repricing and lower cost of credit as our portfolio continues to remain resilient in current market conditions.
As a reminder, our Gross Profit margin is neutral to the level of interest rates in the economy but has compression and expansion depending on the speed of change in interest rates (impacting cost of funding while loan repricing lags due to the duration of our loan products) and speed of growth (impacting IFRS provisioning frontloading). The upward trend in Gross Profit started in Q2-2022, coinciding with SELIC rate reaching 13.75% after bottoming in Q1-2020 at 2.00%, and will continue during 2023 and 2024, to bring us back to our 40%+ steady-state Gross Profit margins. Potential decreases in SELIC rate would accelerate this return to historical average margins. Q1-2023 data has confirmed this trend with significant Gross Profit expansion despite all the market turmoil. As we mature as a company, we are creating the mechanisms to eliminate this fluctuation of margins in the long term by (i) issuing pre-fixed funding notes, (ii) increasing the portion of the portfolio with natural rate matching and (iii) having a clear framework to decide on the hedging of potential interest rate mismatches. We expect credit quality to remain strong during this part of the cycle, with additional tailwinds as the situation normalizes, interest rates start trending down and unemployment remains under control. The unemployment rate, which hovered at 12-15% in 2016-2021,is now stable at a new normal of 8-10%.

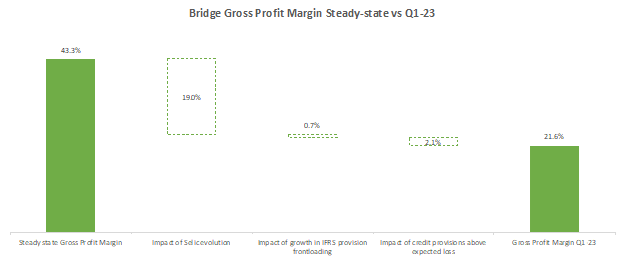
The chart below illustrates the bridge between our steady-state Gross Profit margin (43.3%) and our Q1-2023 margin (21.6%), clearly showing that, despite the negative situation in the consumer credit market, Creditas’ collateralized products deliver significantly lower volatility:
19.0% of Gross Profit margin (87% of the difference) is linked to the evolution of interest rates (mismatch between pre-fixed loans and floating funding sources)
0.7% of Gross Profit margin (3% of the difference) is linked to our portfolio growth, as IFRS frontloads future credit provisions without any consideration of the credit behavior
2.1% of Gross Profit margin (10% of difference) is related to aging of our portfolio cohorts above our expected credit losses.
The market is expecting inflation to end the year around 6.00% (4.65% today) and despite significant local uncertainty, long-term rates to fall below 12%. The Apr-14th Focus report pointed to SELIC falling from current 13.75% to an expected 12.50% by end of 2023 and to 10.00% by end of 2024, only hitting 8.75% in 2026. At Creditas we have built our breakeven plan based on a SELIC rate remaining at 13.75%, which should bring our Gross Profit margin to 30-35% by year end and return us to steady-state 40-45% gross profit in the first half of 2024. If interest rates fall as the market expects, we should slightly accelerate this return to normal margins.
In the chart below we overlap interest rates (SELIC) and inflation rates (IPCA). In the previous monetary cycle, when inflation reached 11.89% in 2016, SELIC stayed at 14.25% for 14 months; it took the BCB 9 months since inflation’s peak to start the interest rate reduction cycle. It has now been 11 months since inflation peaked in the present cycle (11.73% in May-2022) and since then inflation has fallen to 4.65%. Besides inflation, there are certain uncertainties that impact the level of Central Bank interest rates, notably fiscal perspectives and foreign exchange, but all indications point to the nearing of interest rate easing.

Below Gross Margin we recognize 2 types of costs: (i) Customer Acquisition Costs (CAC) that, despite generating gross profit over many years due to the long-term nature of the loans we originate, we recognize upfront and (ii) overhead costs, mostly related to product technology, a cost that unlike some incumbents, we do not currently activate. As we continue building our portfolio, the impact of both CAC and overhead comes down on a relative basis as we get operational leverage thanks to scale. We expect to reduce both costs significantly over the next quarters as we continue growing our revenues and gross profit margins well above the evolution of CAC and overhead. All in, our path to profitability is related to (i) expanding gross profit related to stabilization of SELIC, portfolio repricing and lower impact of frontloading IFRS provisions, (ii) lower impact of customer acquisition cost as portfolio builds and we get higher efficiency in acquiring customers through our own user base and (iii) operational leverage as we continue growing our revenue base to absorb existing overhead that will grow at a significantly lower pace.
In Q1-23 we have continued to reduce both CAC and G&A costs, adapting to the new environment and with a clear focus of doing more with less. Costs below Gross Profit have come down to R$248mn in Q1-23 from R$372mn in Q1-22, a testament of the team’s focus on increasing productivity and efficiency. Our slower growth strategy for 2023 is helping us to bring efficiency to our operation as we switch focus from hyper-growth (275% year on year growth in Q1-22) to moderate growth at this point of the cycle (42% year on year growth in Q1-23). We are investing our time in creating a new growth framework which will help us obtain profitability and growth simultaneously when we turn the corner of the credit cycle in late 2023 to early 2024. We have been reviewing every aspect of our decision-making process, to clearly align on how to prioritize the funds we spend in both distribution and technology development.
Thanks to this discipline around expenses, and despite the gross profit compression experienced with the increase of interest rates, we have been able to reduce our net losses from R$363mn in Q4-2021 to R$129mn in Q1-23. As we accelerate the expansion of gross profit and continue gaining operational leverage, we are confident that we will reach profitability by the end of 2023 and continue with profitable growth in 2024.


***
Definitions
We present all our financials under IFRS (International Financial Reporting Standards). The key definitions of our financial and operating metrics are below:
Portfolio under management – Includes (i) Outstanding balance of all our lending products net of write-offs and (ii) outstanding premiums of our insurance business. Our credit portfolio is mostly securitized in ring-fenced vehicles and funded by both institutional and retail investors. Our insurance portfolio is underwritten by 14 insurance carriers.
New Origination – Includes (i) volume of new loans granted and (ii) net insurance premiums issued in the period. If new loans refinance outstanding loans at Creditas, new loan origination reflects only the net increase in the customer loan.
Revenues - Income received from our operating activities including (i) recurrent interest from the credit portfolio, (ii) recurrent servicing fees paid by the customers from the credit portfolio related to our collections activities, (iii) up-front fees charged to our customers at the time of origination, (iv) take rate of the insurance premiums issued, (v) total price of cars sold and (vi) other revenues from both lending and non-lending products.
Gross Profit- Gross Profit calculation deducts from our revenues (i) funding costs of our portfolio comprising interest paid to investors, (ii) cost of credit including credit provisions and write-offs related to our credit portfolio which, under IFRS, are significantly frontloaded to account for future losses and (iii) acquiring and preparation costs of vehicles sold.
Net Income - Net income deducts from our Gross Profit (i) costs of servicing our portfolio, including headcount, (ii) funds’ operational costs (e.g., auditors, rating, administration fees, etc.), (iii) general and administrative expenses, including overhead, (iv) customer acquisition costs, (v) taxes, and (vi) other income and expenses. We currently don’t activate any of our technology investments which include third party providers, third party platforms and salaries of our product technology team.
Subscribe for
updates
Receive all our news in your email